Published March 25, 2019 | By Mike Petersen
Image Above: Orthman 1tRIPr maintains residues and tills between the rows each year, moving 15 inches each year.
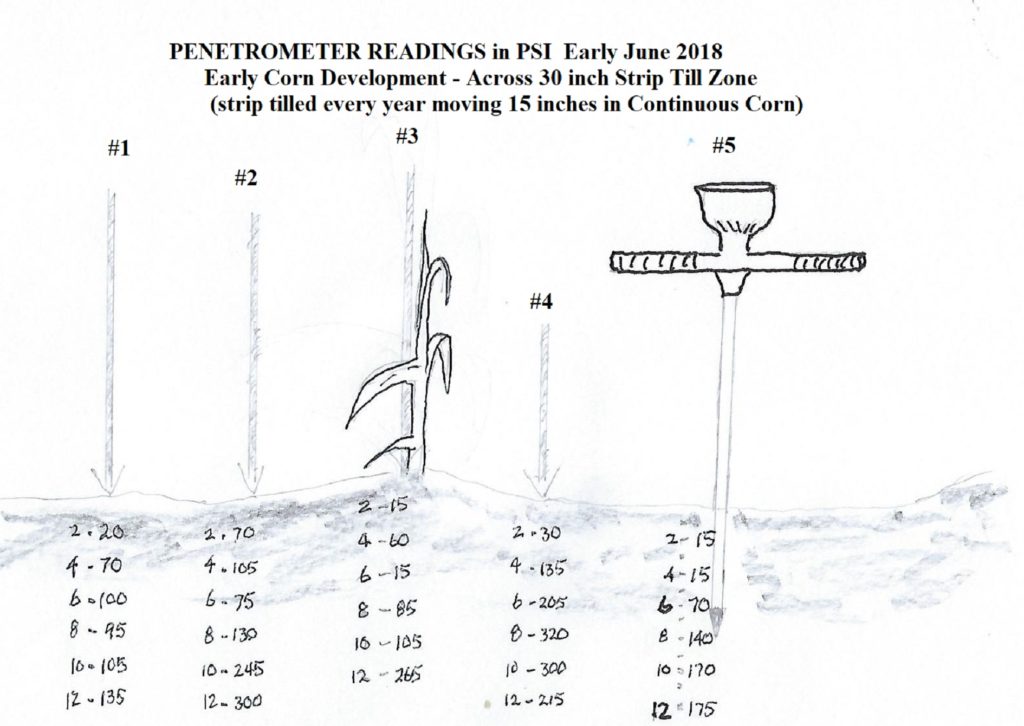
I have waited for some time to get this out to you all. In loam textured soils (22% clay, 47% silt, 31% sand) where a continuous strip till program has been going for over 17 years as of 2019 with continuous corn for 14 of those years, please take a look at the diagram below of what the soil density is when moist in the late spring of 2018. This grower in Eastern Colorado strip tills each spring prior to planting anywhere from 1 week to 5 weeks prior to placing seed in the ground. We then checked with a constant reading penetrometer what the soil resistance was in 5 locations at depths of 0 to 12 inches across a 30 inch row system.
This way we could see what were the remnant effects of 2017 tillage compared to 2018 strip till pass which was completed 2.5 weeks prior to planting in 2018. The penetrometer measured soil resistance to a steady downward force of approximately 1 inch per second. Not to kid you any either, when you push like that at 145lbs drippin’ wet and the resistance is 300 psi – hey that takes effort folks! That methodology is the standard method, so giving a penetrometer a big shove does not represent what kind of force of resistance is truly looking the root square in the eye.
So in 2018 the strip till rig was pulled at 10 inches deep. As you see in the above diagram right in the row where the corn is depicted to be growing at the V3-V4 stage at 12 inches the soil penetration resistance jumped to 265 pounds per square inch. Then as you look to the right, where the probe is, last years effects are a little higher than where it is compared to site #1 off 30 inches to the left.
I do not have a comparison of what a soil penetration profile looks like where no strip tillage tool has run. This diagram offers a below the surface look at what is occurring within a continuous strip tilled field. When we used this tool the soil moisture was within 5-10% of the field capacity.
Takeaways:
1) Soil density below 10 inches shows some sign of higher density that could limit to a degree root extension when the soils dry out
2) In the upper 6 inches the density (by penetrometer) indicates the roots will extend out and down with little to no resistance – a good thing!
3) Above 100 psi the early root system of corn may exhibit slowed growth, as the crop matures the roots have more “push power” and can extend root tip growth up to 400 psi.
4) The maximum root depth as of this date in early June (6/10/18) was 19 inches deep – which is excellent. The plants were at the V-4 stage.
We will be doing more of this kind of field effort, looking into more soil textures and soil conditions this year 2019 to describe more of what the Orthman Strip Tillage system is doing to provide not only an excellent seedbed but the Optimal Root Zone conditions.